Statistics About .de – 2018
Statistics of 2018
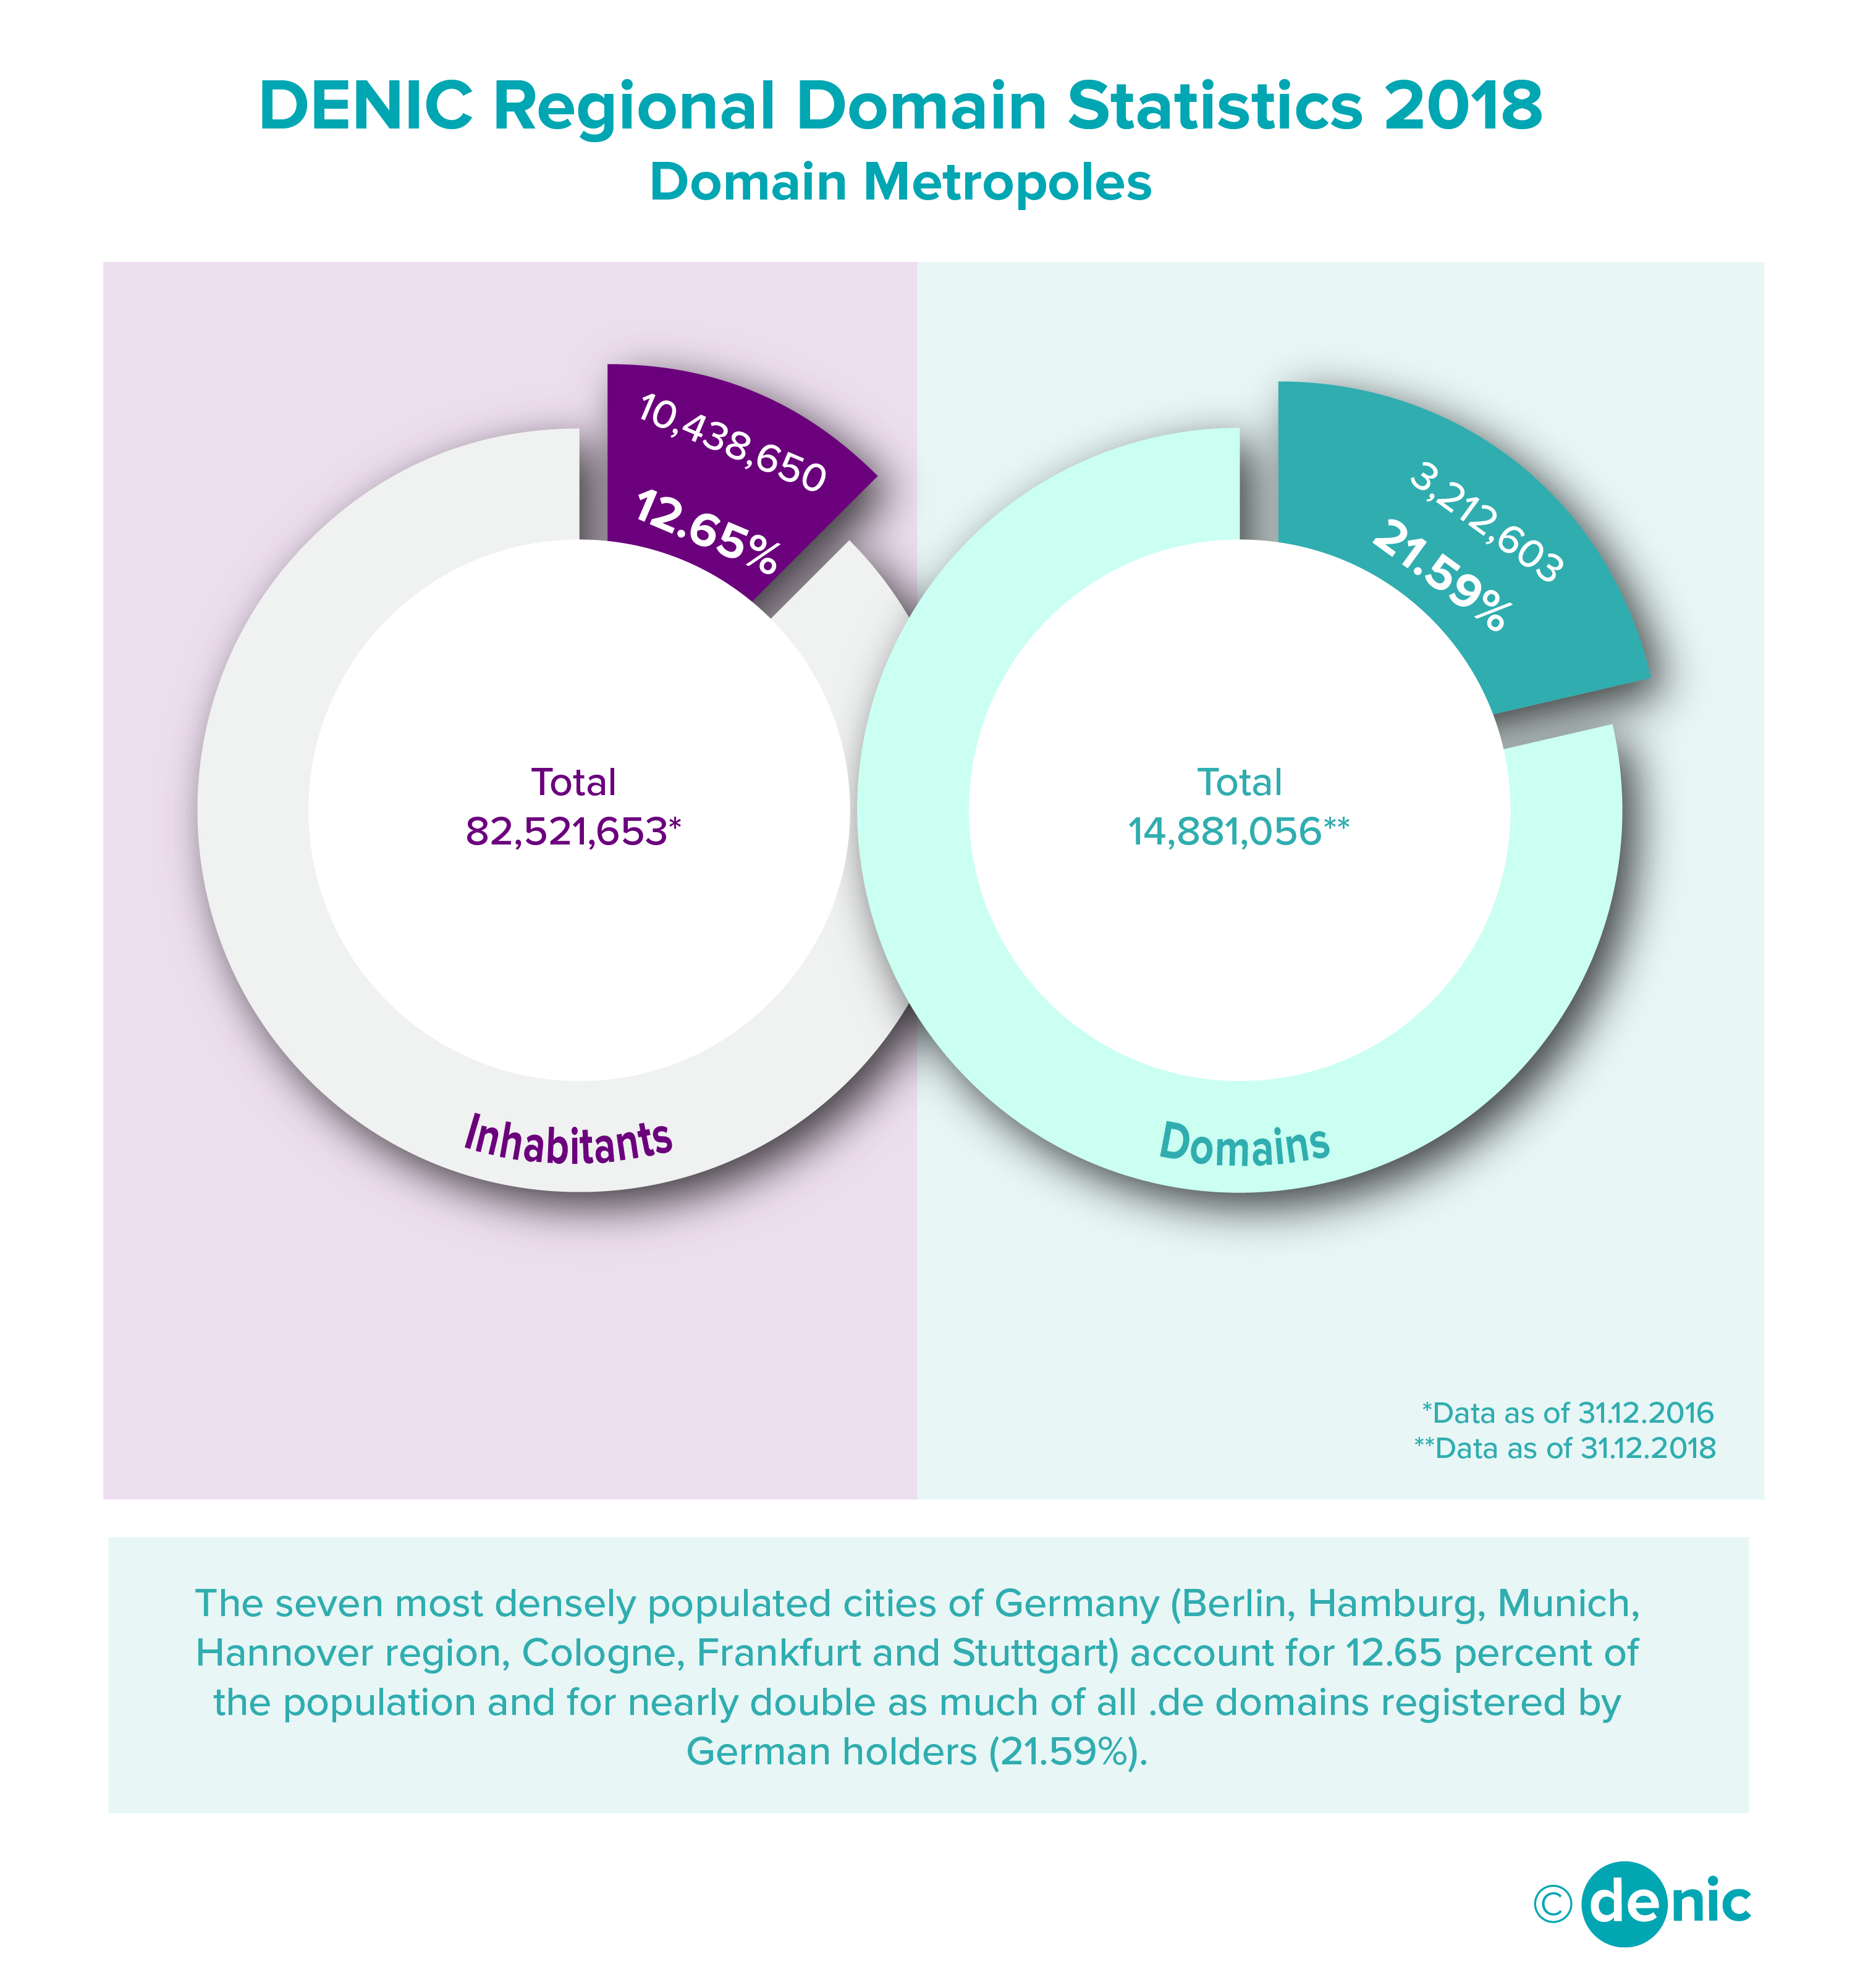
Top 20 Cities and Districts with the Most Domains
| Ranking | 2018 | Domains | 2017 | Domains |
|---|---|---|---|---|
| 1 | Berlin | 1,006,388 | Berlin | 1,010,140 |
| 2 | Munich | 623,494 | Munich | 594,756 |
| 3 | Hamburg | 570,956 | Hamburg | 577,127 |
| 4 | Cologne | 372,868 | Cologne | 372,696 |
| 5 | Osnabrück | 247,578 | Hanover Area | 249,883 |
| 6 | Hanover Area | 232,385 | Osnabrück | 243,305 |
| 7 | Frankfurt am Main | 225,703 | Frankfurt am Main | 227,922 |
| 8 | Dusseldorf | 206,090 | Dusseldorf | 207,103 |
| 9 | Stuttgart | 180,269 | Stuttgart | 183,464 |
| 10 | Nuremberg | 132,801 | Nuremberg | 132,844 |
| 11 | District of Munich | 125,803 | Bonn | 130,195 |
| 12 | Bonn | 125,049 | Rhein-Sieg District | 126,357 |
| 13 | Rhein-Sieg District | 124,759 | District of Munich | 125,884 |
| 14 | Dresden | 121,408 | Dresden | 120,616 |
| 15 | Böblingen, District | 115,276 | Leipzig | 117,023 |
| 16 | Leipzig | 114,287 | Essen | 111,742 |
| 17 | Essen | 110,028 | District of Aachen | 108,519 |
| 18 | District of Aachen | 107,974 | Bremen | 103,894 |
| 19 | Bremen | 103,395 | Stormarn District | 103,862 |
| 20 | Esslingen District | 102,315 | Esslingen District | 103,855 |


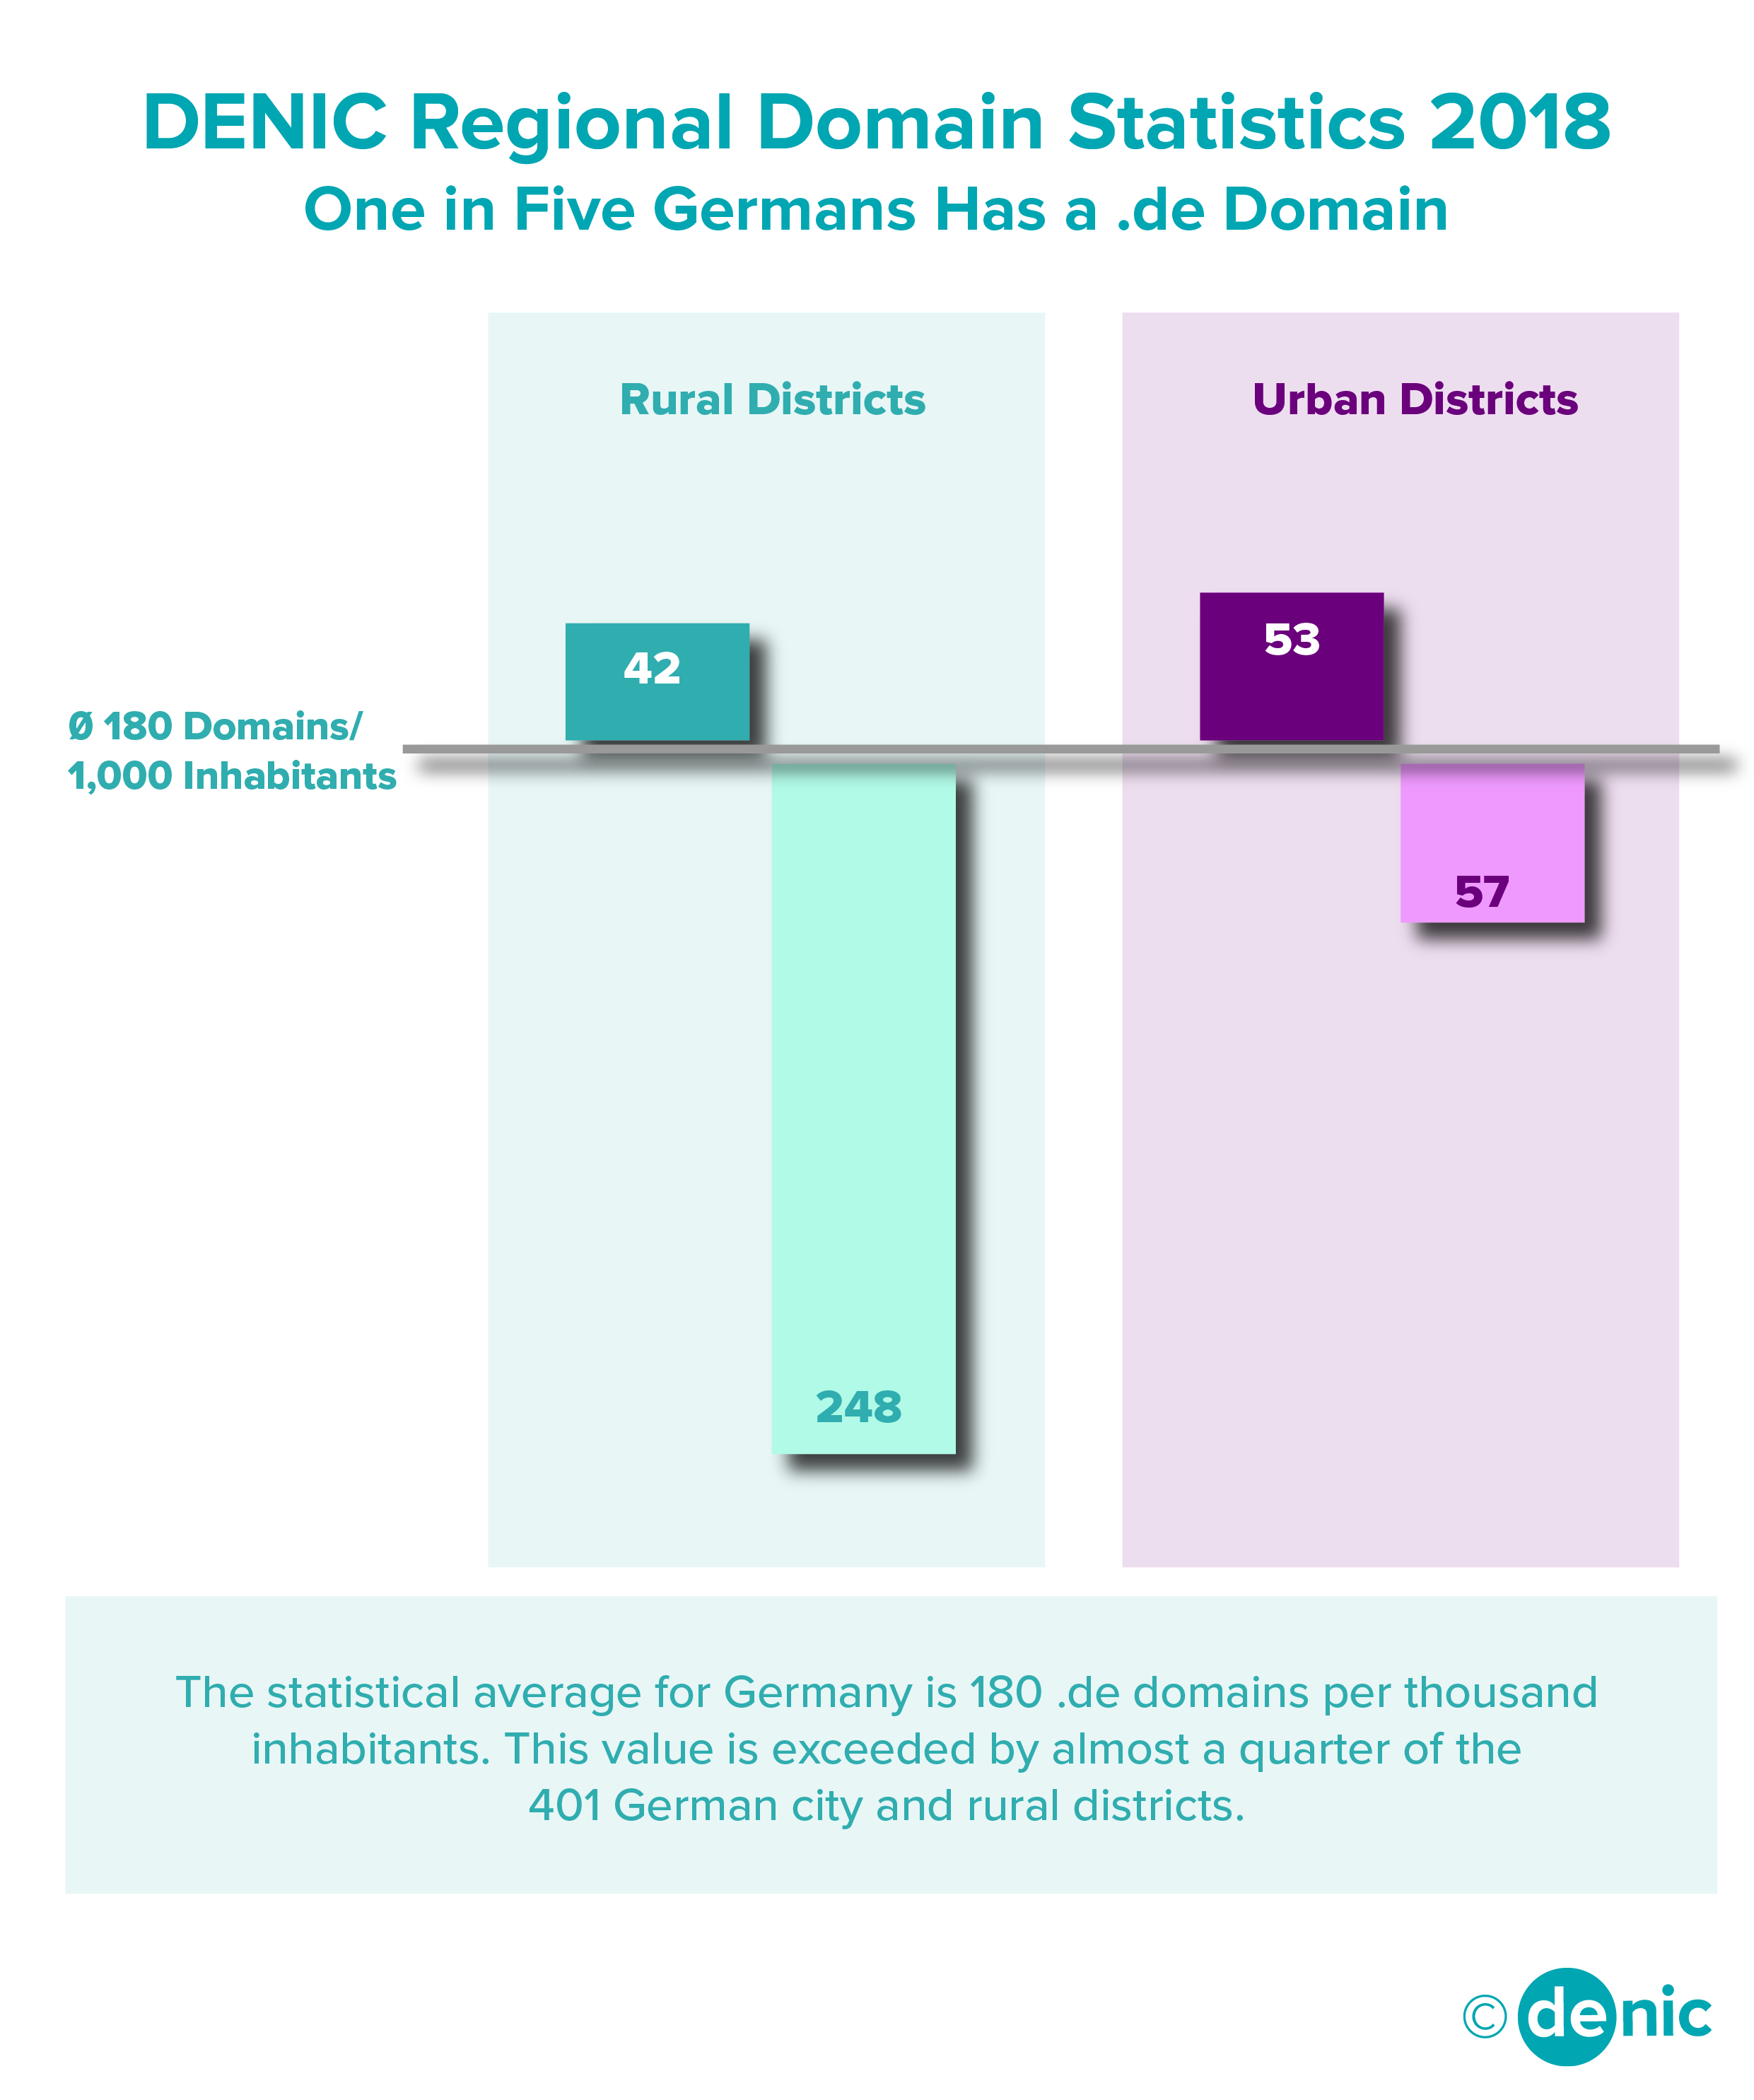
Domain Data According to German Federal States in 2018
| Federal State of Germany | Domains 2018 | Domains 2017 | Domain Increase 2017-2018 in % | Domains per 1K population 2018 | Population (31 Dec 2016) |
|---|---|---|---|---|---|
| Baden-Württemberg | 1,952,272 | 1,950,367 | 0.1 | 178 | 10,951,893 |
| Bavaria | 2,653,459 | 2,643,522 | 0.4 | 205 | 12,930,751 |
| Berlin | 1,006,388 | 1,010,140 | -0.4 | 282 | 3,574,830 |
| Brandenburg | 291,602 | 294,746 | -1.1 | 117 | 2,494,648 |
| Bremen | 112,257 | 112,852 | -0.5 | 165 | 678,753 |
| Hamburg | 570,956 | 577,127 | -1.1 | 315 | 1,810,438 |
| Hesse | 1,232,309 | 1,229,140 | 0.3 | 198 | 6,213,088 |
| Lower Saxony | 1,369,079 | 1,391,662 | -1.6 | 172 | 7,945,685 |
| Mecklenburg Western Pomerania | 170,265 | 172,573 | -1.3 | 106 | 1,610,674 |
| North Rhine-Westphalia | 3,262,603 | 3,298,218 | -1.1 | 182 | 17,890,100 |
| Rhineland-Palatinate | 641,723 | 650,230 | -1.3 | 158 | 4,066,053 |
| Saarland | 139,917 | 141,130 | -0.9 | 140 | 996,651 |
| Saxony | 527,960 | 532,049 | -0.8 | 129 | 4,081,783 |
| Saxony-Anhalt | 184,179 | 187,969 | -2.0 | 82 | 2,236,252 |
| Schleswig-Holstein | 532,841 | 586,162 | -9.1 | 185 | 2,881,926 |
| Thuringia | 233,246 | 235,515 | -1.0 | 108 | 2,158,128 |
| Germany | 14,881,056 | 15,013,402 | -0.9 | 180 | 82,521,653 |
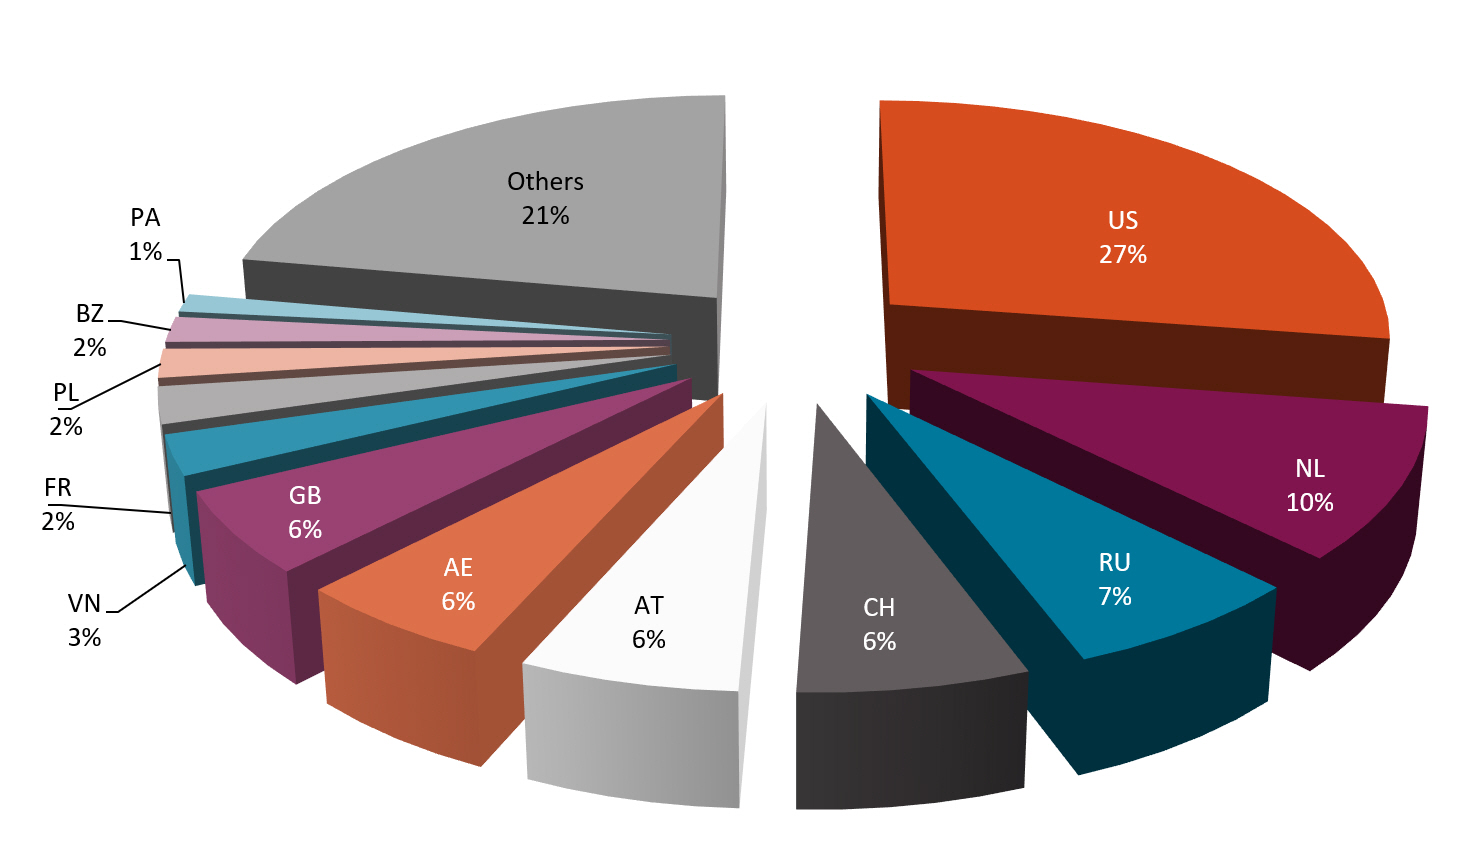
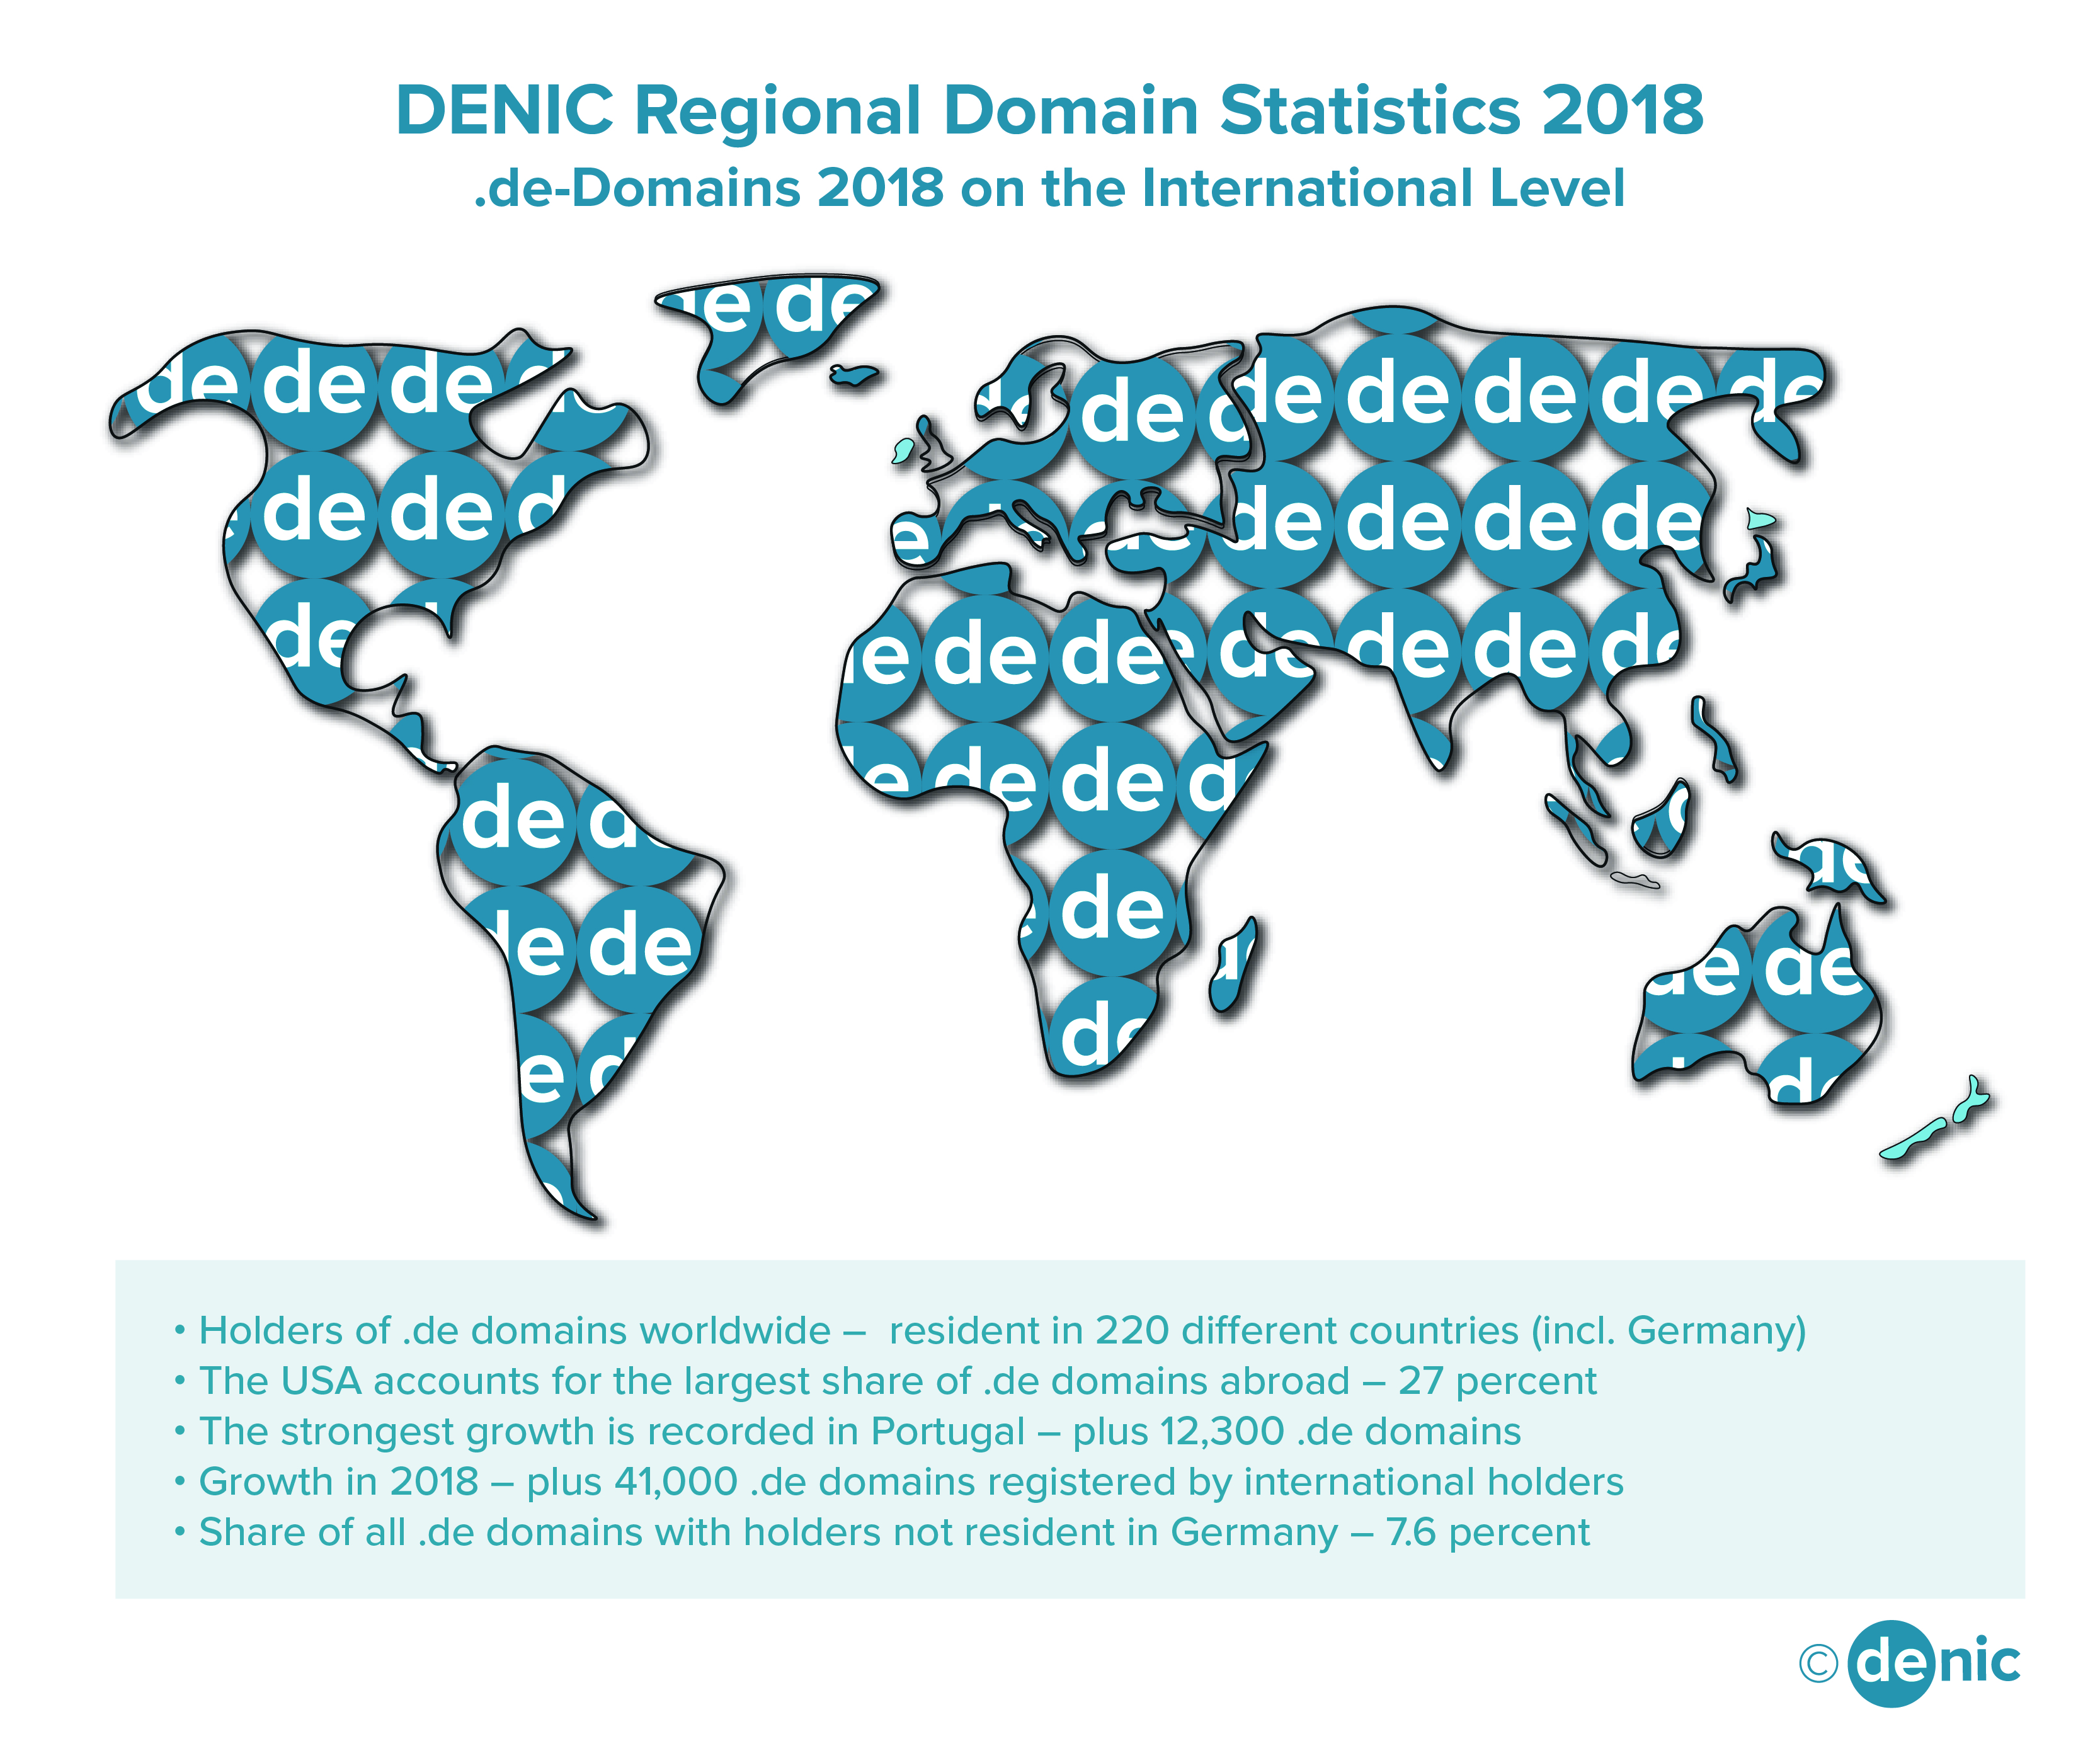
Place of Residence of Domain Holders from Outside Germany
At the end of 2018, 1,225,965 .de domains were registered for holders domiciled outside Germany. The graph shows how they are distributed over the various countries in the world.
Domain Holders Outside Germany 2018

The 10 Cities and Districts with the Highest Pro-Rata Increase in 2017-2018 Domain Numbers
| Ranking | City/District | Federal State | Domains 2018 | Domains 2017 | Domain Increase 2017-2018 in % | Domains per 1,000 population 2018 | Population (per 31 Dec. 2016) |
|---|---|---|---|---|---|---|---|
| 1 | Suhl | Thuringia | 7,663 | 5,944 | 28.9 | 215 | 35,608 |
| 2 | Böblingen, District | Baden-Württemberg | 115,276 | 97,251 | 18.5 | 299 | 385,888 |
| 3 | Altötting, District | Bavaria | 14,588 | 12,742 | 14.5 | 133 | 109,422 |
| 4 | Main-Taunus-Kreis, District | Hesse | 77,180 | 68,023 | 13.5 | 327 | 235,708 |
| 5 | Kaiserslautern, District | North Rhine-Westphalia | 12,793 | 11,756 | 8.8 | 121 | 105,504 |
| 6 | Bad Kreuznach, District | North Rhine-Westphalia | 23,527 | 22,196 | 6.0 | 149 | 157,392 |
| 7 | Offenbach, District | Hesse | 80,253 | 75,981 | 5.6 | 229 | 349,982 |
| 8 | Kitzingen, District | Bavaria | 15,664 | 14,830 | 5.6 | 175 | 89,748 |
| 9 | München | Bavaria | 623,494 | 594,756 | 4.8 | 426 | 1,464,301 |
| 10 | Dingolfing-Landau, District | Bavaria | 10,281 | 9,812 | 4.8 | 108 | 95,035 |
The 10 Cities and Districts with the most Domains per Inhabitant 2018
| Ranking | City/District | Federal State | Domains 2018 | Domains 2017 | Domain Changes 2017-2018 | Domains per 1,000 population 2018 | Population (per 31 Dec. 2016) |
|---|---|---|---|---|---|---|---|
| 1 | Osnabrück | Lower Saxony | 247,578 | 243,305 | 1.8 | 1,509 | 164,070 |
| 2 | Freising, District | Bavaria | 76,440 | 76,683 | -0.3 | 435 | 175,803 |
| 3 | Munich | Bavaria | 623,494 | 594,756 | 4.8 | 426 | 1,464,301 |
| 4 | Starnberg, District | Bavaria | 53,587 | 53,951 | -0.7 | 398 | 134,732 |
| 5 | Bonn | North Rhine- Westphalia | 125,049 | 130,195 | -4.0 | 388 | 322,125 |
| 6 | District of Munich | Bavaria | 125,803 | 125,884 | -0.1 | 366 | 343,405 |
| 7 | Cologne | North Rhine- Westphalia | 372,868 | 372,696 | 0.0 | 347 | 1,075,935 |
| 8 | Dusseldorf | North Rhine- Westphalia | 206,090 | 207,103 | -0.5 | 336 | 613,230 |
| 9 | Main-Taunus-Kreis, District | Hesse | 77,180 | 68,023 | 13.5 | 327 | 235,708 |
| 10 | Hamburg | Hamburg | 570,956 | 577,127 | -1.1 | 315 | 1,810,438 |
Downloads
Excel Sheet Data of All Cities and Districts in Germany 2018
Excel Sheet Overview of Top 20 Cities since 2003
Excel Sheet Development of .de Domains in Federal States of Germany since 1999
Graph Federal States of Germany 2018
High-Resolution Map of Absolute Numbers of .de Domains in 2018 in PDF Format
High-Resolution Map of Number of Registered .de Domains per 1,000 Inhabitants in 2018 in PDF Format
.de Domain Holders outside Germany in 2018
Graph .de Domains international 2018
Graph Ratio Inhabitants to.de Domains in the 7 largest Cities of Germany in 2018
Graph Ratio Inhabitants to.de Domains in the Cities and Districts of Germany in 2018
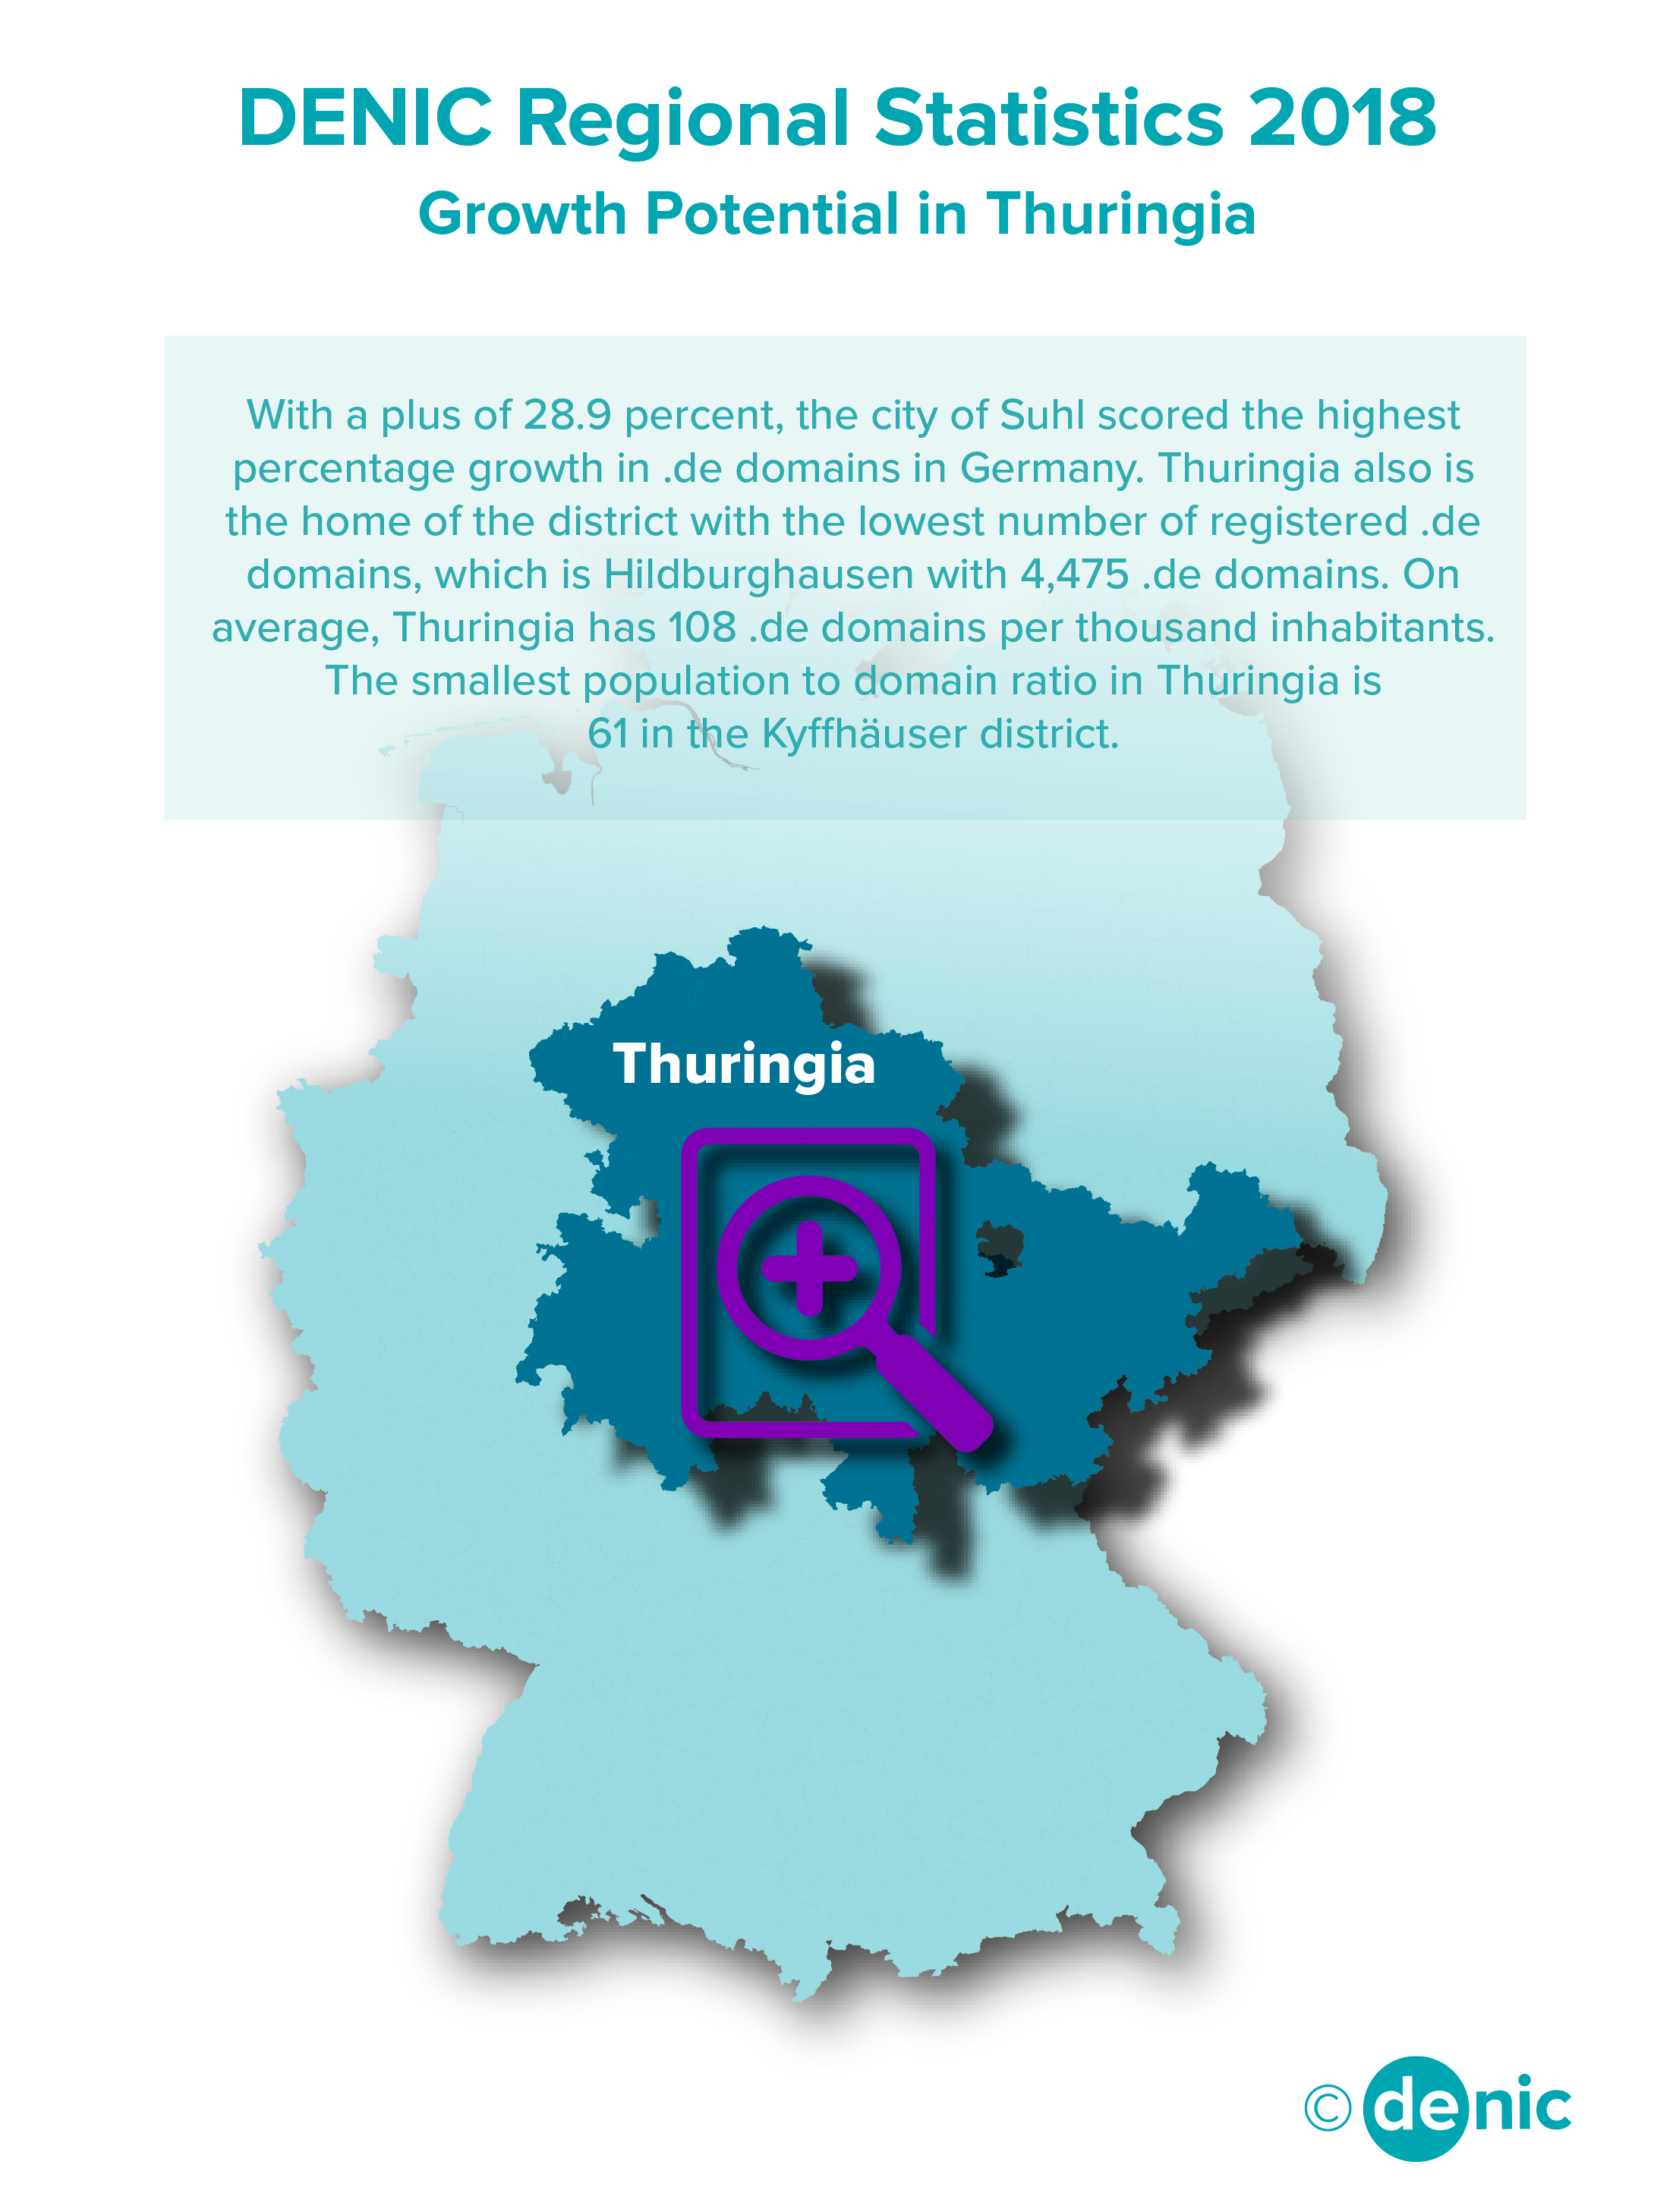
Graph Spotlight Thuringia